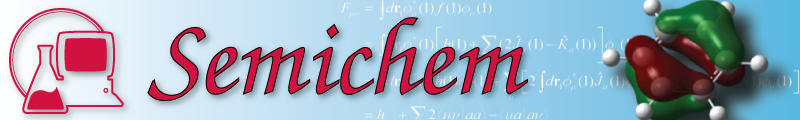
Manage Molecular Orbitals Graphically
This dialog box shows the molecular orbital energy
management dialog box showing the MOs of benzene. The MO displayed
is one of the HOMOs (see the checked red box.) The HOMO/LUMO
orbitals are highlighted in yellow. Electrons can be dragged
and dropped between orbitals to arrange occupancy and spin state. |
 |
 |
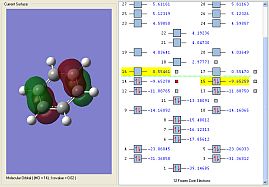
3D Reaction Surface Plot
A potential energy surface from a
2-coordinate reaction pathway is displayed here. This
calculation can be set up within AGUI using its intuitive tools. |
Transition Metals-Copper Surface
This image shows a
small segment of a 34-atom copper elemental surface with a formate
molecule adsorbed on the top layer. The three white dots are
dummy atoms that are being used to aid in defining the geometry of
the formate. |
 |
 |
pdb Files-DNA Segment
This image shows am AMPAC GUI visualization of a short segment of
DNA loaded from a pdb file. Note that AGUI completed the
valences by adding hydrogen atoms to those places that were needed. |
Building Structures
This image is a spiro-ortho carbonate that was constructed
using both fragment and atom-by atom methods. The builder in
AMPAC's GUI builds molecules like chemists think. |
 |
 |
Charge Display
The atoms in this image are colored by charge, where green atoms are
positive and red atoms are negative. The intensity of the
color shows the magnitude of the charge. Numerical values can
also be displayed. An image of this screen can be captured and
inserted in a publication or presentation. |
Electrostatic Charge on a Surface
Here is shown a colored display of the electrostatic charge computed by AMPAC
has been superimposed on an electron isodensity surface. The
positive and negative regions of the molecule show where polar
reactions might be more or less likely. |
 |
 |
ONIOM Setup for Gaussian03™
This image shows a DNA polymerase with an included substrate.
AGUI can define low, middle and high layers for the MM/QM treatment
of this system. |
Display of Molecular Orbitals
This image shows a molecular orbital superimposed on the structure
of a molecule. Any MO can be displayed. Difference
between MOs and other plotted properties can also be plotted. |
 |
 |
Display of Vibrational Modes
The arrows attached to the atoms in this display indicated the
directions and magnitudes of a particular vibrational mode.
The modes can also be animated and simulated spectra produced. |
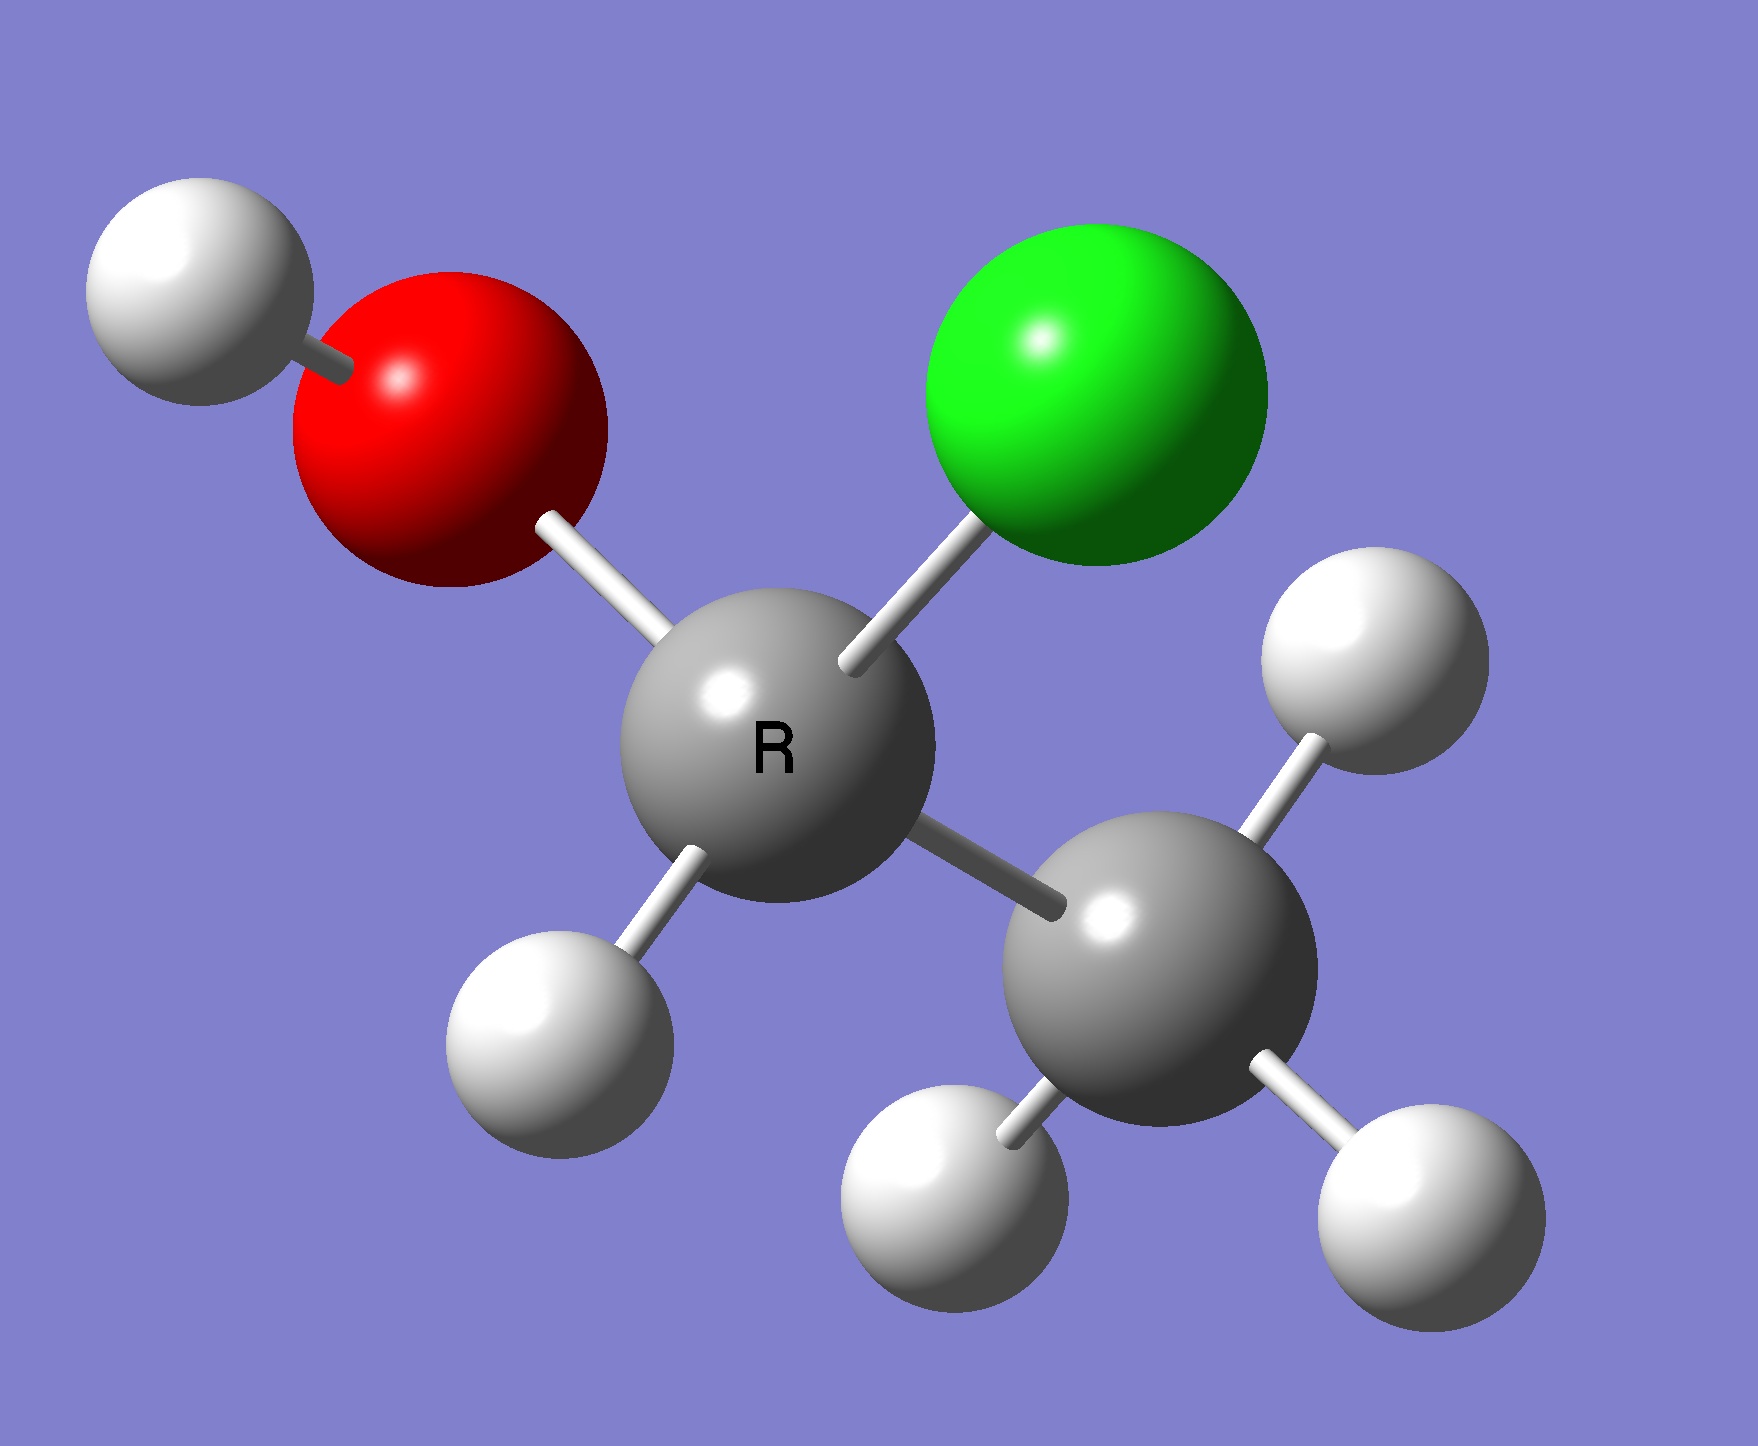
Stereochemistry
AGUI will determine the absolute stereochemical configuration of each chiral center in the
molecule at the push of a button!. |
 |
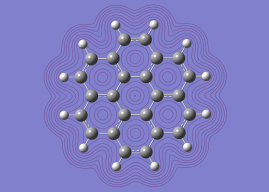 |
2D Property Contours
This image shows a 2D plot of total electron density projected onto the
plane of this aromatic system. |