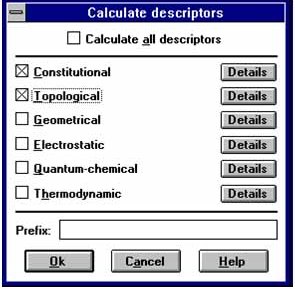
Descriptor Selection Dialog Box
This dialog box sets the particular descriptors that will
be computed. |
 |
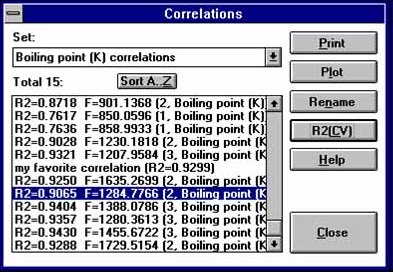 |
Correlations Presented by Heuristic Analysis
Shown here are the ranked list of
descriptors selected by the heuristic method. |
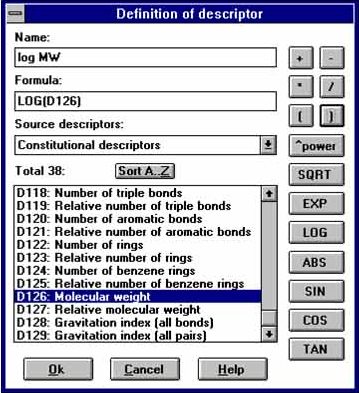
Descriptor Construction
This dialog box illustrates how complex descriptors
can be defined using various mathematical operations. |
 |
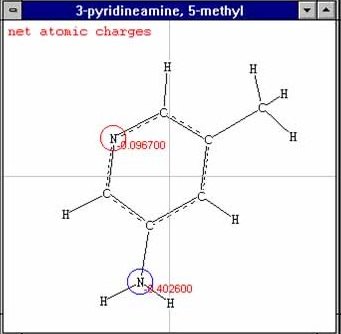 |
Descriptor Value Display
This image shows actual descriptor values
centered on atoms that CODESSA can display. |
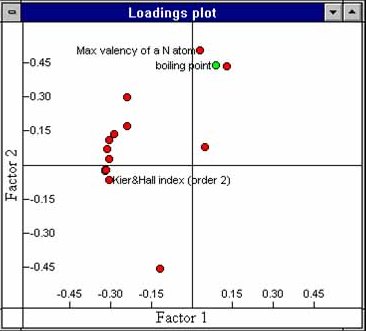
PCA Loading Plot
This image illustrates the information available to
facilitate cluster analysis. |
 |
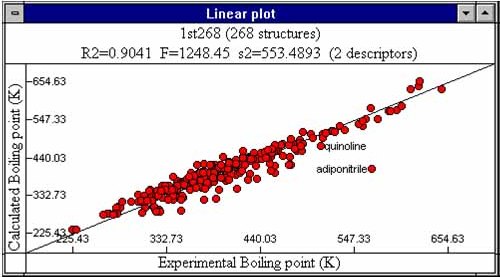 |
Correlation Plot
This is the key display of the experimental vs. calculated results
with statistical indexes and the correlation equation line. |